
Your software application will crash. Even the most principled software following the best practices will inevitably have a bad day. Figuring out why it crashed and how to prevent it is a skill in and of itself. Fortunately there are steps you can take to help you when this time comes. Application logs are your friend and it is necessary to learn how to read them.
One of the worst feelings for a software engineer is finding out your application crashed. Generally the thought that proceeds that knowledge is (hopefully): what happened and how do I fix it?
Since I recently had an experience somewhat parallel to this, I thought it prudent to talk about logging. While this is a broad topic I’m going to use this opportunity to narrow the focus slightly.
Setting up a hypothetical situation
Let’s pretend you have a web application that has been in production for a while. Let’s also pretend that this application has an irregular deployment schedule. While we’re pretending, let’s say that a new version is deployed early one morning. Later that day the business reports that it is performing slowly. What do you do? How do you handle it?
Maybe your knee-jerk reaction is to rollback the deploy? Perhaps you pull up the recent commit log and start looking for any potential issues that slipped through code-review and QA. None of these responses are invalid of course, but I intentionally left off the most obvious answer: check your application logs.

What types of logs are there?
In order to treat the topic correctly it is important to understand there are multiple types of logs. Depending on the type of application you’ve developed, you may only have a couple of logs or you might have several. Some examples are system logs, server logs, application logs, and analytics logs. There are plenty of other types of logging as well.
Application Logs
In our hypothetical situation this is likely (hopefully?) the first place you’ll look. Application logs are a type of custom logging within the context of your application. Several programming frameworks offer built-in logging support such as .NET Core’s ILogger. These logs are driven by configurable log levels to broaden or narrow the scope. Traditionally these logs are stored on the file-system and might be shipped to a more robust log management tool. That’s a topic of it’s own.
Log levels vary from framework to framework but the following is a list as found in .NET Core (re-sorted by verbosity, low to high):
- None: No logs will be produced
- Critical: Typically only critical/unrecoverable issues such as application or system crash.
- Error: Logs exceptions in current flow. Typically found in a try/catch and would include both the exception and contextual data.
- Warning: Logs that highlight abnormal or unexpected event in application but not things that block flow. These might be an indication of a problem.
- Information: Tracks the general flow of the application. These would have long-term value. Application events for general purposes.
- Debug: Information used specifically for debugging purposes but no long-term value.
- Trace: Logs that contain most detailed messages. Might contain sensitive application data. Generally should not be used in production.
Web/Server Logs
Another place in our hypothetical situation you might look as you’re seeking to understand your application’s failure are the web/server logs. For this example we’re going to pretend your application is hosted in Microsoft IIS.
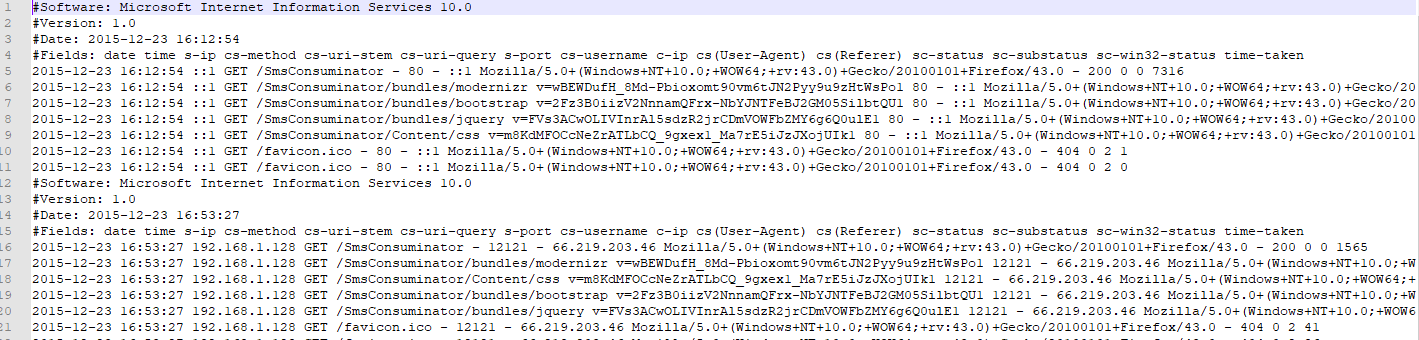
IIS logs have a bunch of default fields and a certain amount of customization available. I don’t want to spend so much time focusing here on what you can customize but in a bit we’ll circle back to look at how to interpret these logs.
System Logs
System logs are going to track events at the operating system level. There will be instances in which your web server or other application fail so hard that it can’t log what happened. In Windows this is the Event Viewer. You can actually set up your own application to log directly into Event Viewer as well, by the way, but there are generally “better” ways to handle your application logs.
Analytics
Since our hypothetical application is web based, you probably have some form of analytics. Probably even the ubiquitous Google Analytics (GA). The first thing I want to point out here is that GA is wrong. Not wrong in the sense of “oh my gosh, that’s so wrong!” Rather, since GA relies on Javascript tracking methods and those tracking methods can be blocked in a myriad of ways, chances are it is not reflecting as much of your traffic as you want. In fact, it is probably so far off these days that it cannot be trusted to actually be reflective of your true audience. Just my 2 cents.
That being said, it’s there. Analytics suites come in various shapes and sizes and are another potential source of logging information.
Composing Logs
Having logging is only one piece of the pie. It is equally important to have logs in the first place as it is knowing what to log. This generally applies to application logging since the other forms of logging (system logs, server logs, analytics) are already handled by the providers.
Logging Exceptions
The most obvious use-case here is logging exceptions. It is also frequently the only use-case people consider. What should you log though? Remember the “W” words of your youth? Who, what, when, where, and why. That’s what you want to capture. The more context you can give to an exception, the better prepared you are to reproduce and fix exceptions.
This should translate to who was executing the code? When did the exception occur? Where in the code did the failure occur? What was your application doing when it failed? Why… well… that’s why you’re logging the exception, now isn’t it? Your sleuthing skills paired with this information should determine the why.
What and where are frequently the same thing. Record a stack-trace from the exception and add some data parameters as necessary. Keep in mind that you want to take the same precautions with your error logging as other logging. Don’t include sensitive data without checks and balances.
What else should I log?
I feel like it is a fair statement to say that most of us log only exceptions. While perfectly valid, this is a narrow view. I don’t want to go into too much detail here since others have already done it (I suggest Coralogix’s post). I’ll summarize briefly the categories of logging they suggest:
- Authentication, Authorization, and Access: Successful and failed authentications and authorizations, system access, data access, and application changes.
- Changes: Changes to systems or applications, changes to data (CRUD), and application installation and changes.
- Availability: Including startup and shutdown of systems and applications, faults and errors that affect availability, and backup successes and failures.
- Resources: Exhausted resources, exceeded capacities, and connectivity issues.
- Threats: Common threats such as invalid inputs and security issues known to affect the application.
Per the list and descriptions above, some things within the descriptions may not apply to your application. The overall categories, however, do apply. Consider authentication/authorization/access – if your log tracks that as information, for example, gives you insight into how often, when or where they occur, and more. You might not have a use for that today but later on it may become relevant data.
Reading/Interpreting Logs
Next up, it is important to know how to read and interpret the logs. Let’s use our hypothetical situation again.
Google Analytics
Consider that for some reason the application seems really slow. Your first thought is to look at Google Analytics to see what’s going on. GA shows that your user count has dipped. That’s strange, right? Wouldn’t you think you’d see more users? You begin to wonder that perhaps the application has some deadlock situation or something else going on.
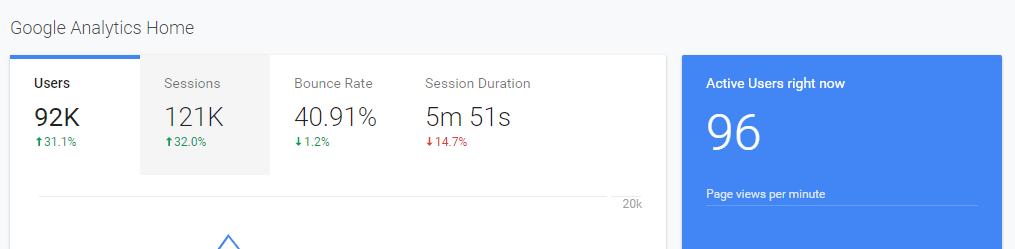
If you based your decision solely on the scenario above you’re going to feel like the build is what is causing the issue. The proof is in the pudding, right? Wrong. As I brought up before — Google Analytics is easily blocked and doesn’t come close to giving a full picture.
In my opinion — and take it for just that — GA is useful as a marketing snapshot. It is not statistically significant nor indicative of how well your site is really doing in any measurable fashion.
Web Server Logs
Next in our story are your web server logs. In our case, IIS.
There are plenty of tools built to read and interpret IIS logs. One that I’ve had experience with is SmarterStats. This application will load in IIS logs and perform all sorts of metrics upon them. Since it is loaded on the server, it has access to much more rich information including a full snapshot of traffic trends. It is by no means the only tool out there, just an example.
Other important logging tools will be performance monitoring and “heartbeat check” applications. There is a multitude of tools (called APM or application performance management) that track health of your application and server.
APM
For the sake of our hypothetical situation, lets see a response time graph that might look like.

Let’s pretend for a moment that this graph showed some flatlines. Those would signify in some way that the application is timing out, possibly offline. Here’s another sample of what that might look like:
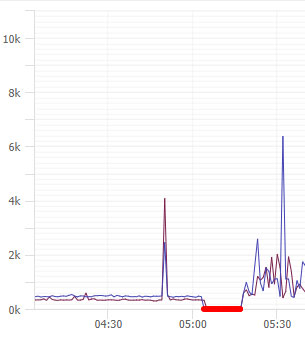
In the hypothetical example we’ve set up for today, we said that a deploy happened in the early morning. That is represented by the red flatline. It is interesting to see a spike in response times before the deployment. This is a very interesting clue but by itself, not enough information. We need to dig deeper.
SmarterStats
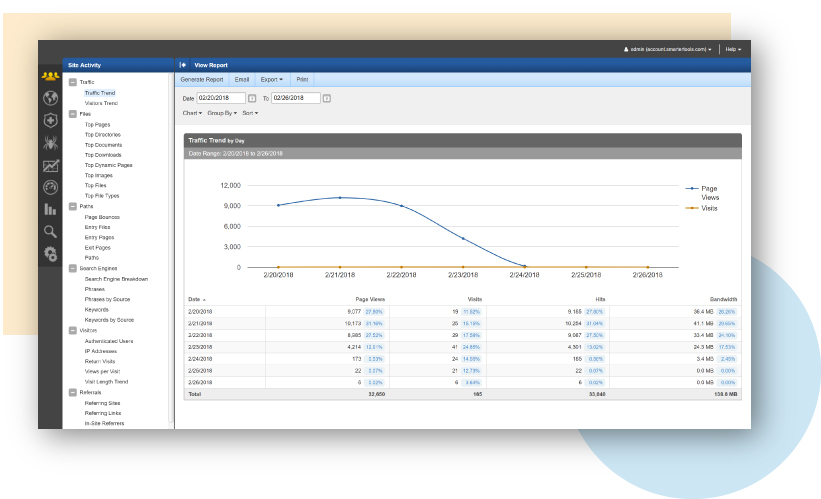
Consider the image above. If you saw traffic that trended down while the server was performing badly you’re going to assume it is due to an issue. I think you’d be correct in that assessment. What if, however, you actually saw that traffic trend *up* while the performance was trending down? What would you think?
If you’re a PC gamer you’ve likely heard of Steam. Steam is an online store / DRM / game management tool. They used to be known for having incredible sales a few times a year. Each time a sale came up their servers would crawl to a standstill due to the incredible traffic. That seems like a pretty logical conclusion — the servers simply cannot handle the increase in traffic.
Back to our hypothetical story. Let’s assume that our graph on SmarterStats showed that the traffic difference between the day of the deploy and the day before showed a net increase of over 100k page views. First of all, what is a page view? Page view is the total count how many times an endpoint was hit. Visitors, on the other hand, are unique visitors and this becomes important in a moment.
You see your graph and you see that page views have trended up by 100k from one day to the next. You’re thinking that can mean a few different things: 1) you have a run-away AJAX call, 2) somehow your app hit the SEO jackpot, 3) you’re under attack.
In order to help narrow this down you pull the top pages report for each of those days. Scrolling through you start to get an idea of how many users to page views ratio your endpoints normally have. The report for the day in question shows a 35x increase in page view to visitor ratio on several endpoints. Ok… this is bad. Again though, you don’t know if it’s because those endpoints somehow are in a loop or what.
Maybe another report will help you? How about the IP Addresses report? You pull that up and holy crap on a cracker, you’ve got one single IP address that has made 150k requests on this one day alone! Congratulations, you’re under attack.
Raw Logs (Log Parser studio)
So maybe you don’t have SmarterStats or a similar application. Perhaps all you have are raw logs. Reading those by hand just ain’t gonna happen. There has got to be a way to look through them for free though, right? Right.
Log Parser Studio (see also [here])is a dated tool by Microsoft. Don’t let it’s age fool you though, it is useful. They also have a much older CLI tool that can do the same called Log Parser 2.2.
LPS can parse multiple log formats, not just IISW3CLOG format. For our hypothetical situation, however, IISW3CLOG is our target. Let’s try to recreate the reports from SmarterStats using LPS. Look at W3C Logging for details on which fields IIS can log and what they appear as in the log.
First of all, LPS doesn’t really have anything built in to ignore (or group) certain content types like SmarterStats does. That means our queries will all need to be built with that in mind. We probably don’t care how many times the images, javascript, css, or similar “content” files are loaded.
Let’s look at our “total page views” first. We need to set up a new query and target log type IISW3CLOG. We also need to set up which log(s) we want it to parse. Let’s look at our query now:
SELECT
  COUNT(*) AS Total
FROM '[LOGFILEPATH]'
where cs-uri-stem not like '%.css%'
   and cs-uri-stem not like '%.js%'
   and cs-uri-stem not like '%.woff%'
   and cs-uri-stem not like '%.svg%'
   and cs-uri-stem not like '%.png%'
   and cs-uri-stem not like '%.jpg%'
   and cs-uri-stem not like '%.ico%'
In the above query we’re just simply taking a total but excluding several different content types based on the extension. I’m sure that’s a pretty lame query and somebody can come up with a cleaner way to do it. Go for it.
We can pretty easily modify that query to get us a count by IP address:
SELECT
  c-ip,
  COUNT(*) AS Total
FROM '[LOGFILEPATH]'
where cs-uri-stem not like '%.css%'
   and cs-uri-stem not like '%.js%'
   and cs-uri-stem not like '%.woff%'
   and cs-uri-stem not like '%.svg%'
   and cs-uri-stem not like '%.png%'
   and cs-uri-stem not like '%.jpg%'
   and cs-uri-stem not like '%.ico%'
GROUP BY c-ip
ORDER BY Total DESC
How about a report for top pages?
SELECT TOP 100
  cs-uri-stem,
  COUNT(*) AS Total
FROM '[LOGFILEPATH]'
where cs-uri-stem not like '%.css%'
   and cs-uri-stem not like '%.js%'
   and cs-uri-stem not like '%.woff%'
   and cs-uri-stem not like '%.svg%'
   and cs-uri-stem not like '%.png%'
   and cs-uri-stem not like '%.jpg%'
   and cs-uri-stem not like '%.ico%'
GROUP BY cs-uri-stem
ORDER BY Total DESC
And then how about the one I talked about with page view vs unique visitors? I actually don’t have any clue. Unfortunately LPS and Log Parser 2.2 don’t handle JOIN or APPLY statements and I’m pretty sure that’s the only way we could accomplish that.
For more help, here is a page of example queries (log parser, but applicable to LPS just the same).
Conclusion
In our hypothetical situation we learned that we needed to make use of multiple log types/sources in order to track the issue. It became apparent that it was a tragic coincidence. The site was not affected adversely by the deploy. Instead, it appears that a denial of service attack began 15 minutes before the deploy and continued to be in effect afterwards. We were able to ascertain normal traffic behavior for our endpoints and the anomalous behavior against the same.
Application logs are your friend. I hope this brief introduction to application logging helps you in your software journey. Application logging is a critical component to successful software and it is important to learn how to read them. Before you panic and rollback, always be sure to read your logs.
Credits
Photo by Taylor Vick on Unsplash